Performance-Based Asset Management Best Practices – Making Your Data Work for You with Dashboards

We are all familiar with the day-to-day activities happening throughout our organization.  Lots of things are happening and this information is being captured in our Asset Management System throughout the day, week month and year.  Information is an asset in and of itself, but it is neglected at many organizations because of the focus on “today’s” activities.  Dashboards can provide a passive way of visualizing data so that Performance metrics can be monitored (e.g. How many Issues are older than 24 hours?).  It can also provide Insights into your data that are not easily seen in tabular layouts of data Filters and Reports. This information should be presented to the Asset Management user in a way that is relevant to their day-to-day activities and should be interactive, giving the user control over the information in front of them.

2017-02-01 09_41_55-VUEWorks® 10.2.1962.0 Project_ vueworks Host_ demo.vueworks.com User_ VUEWorks

VUEWorks set out to create this exact user experience when we decided to overhaul our Dashboard tools.  The following goals were presented to the Development team along with their associated User Stories.  This process would focus on the User, so we also enlisted many key clients from our customer base to provide the guidance necessary to achieve these goals:

  • Provide a Unique User Experience, focused on the Individual User as well as Groups of Users who share the same, common information.
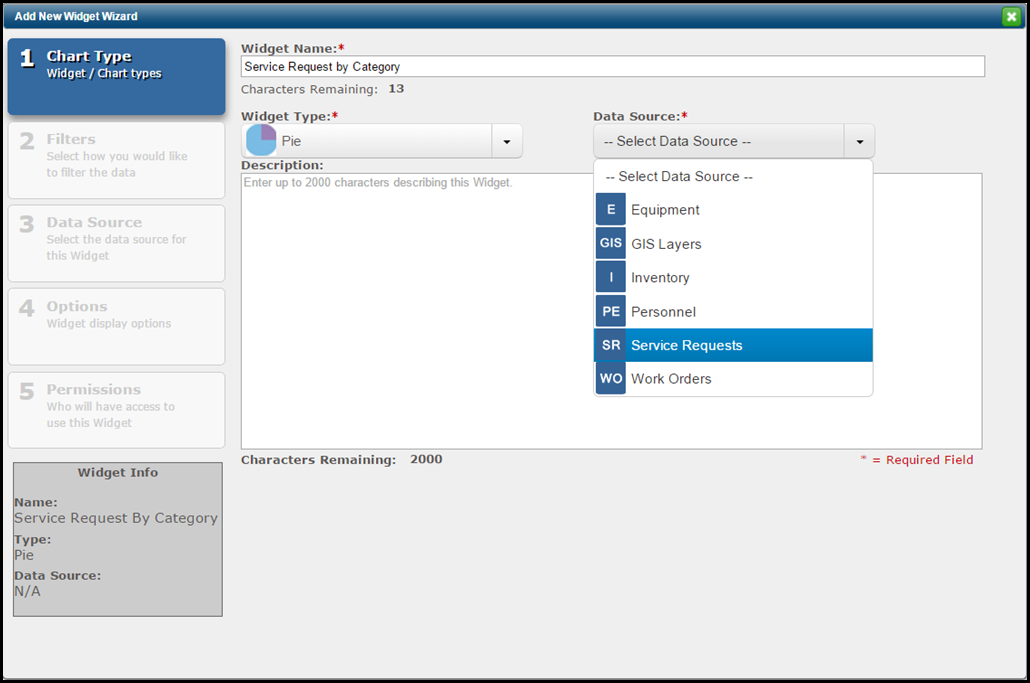
  • Provide a Wizard-driven User Interface (UI) to make it easy for anyone to author their own Dashboard Widgets.

2017-02-01 09_17_07-VUEWorks® 10.2.1962.0 Project_ vueworks Host_ demo.vueworks.com User_ VUEWorks2017-02-01 09_24_18-VUEWorks® 10.2.1962.0 Project_ vueworks Host_ demo.vueworks.com User_ VUEWorks

  • Expose all Data Sources and GIS Layers to allow for ANY type of Dashboard to be created.
  • Provide a series of commonly used Dashboard Widget Types and share them among users within the organization.

2017-02-01 09_24_18-VUEWorks® 10.2.1962.0 Project_ vueworks Host_ demo.vueworks.com User_ VUEWorks

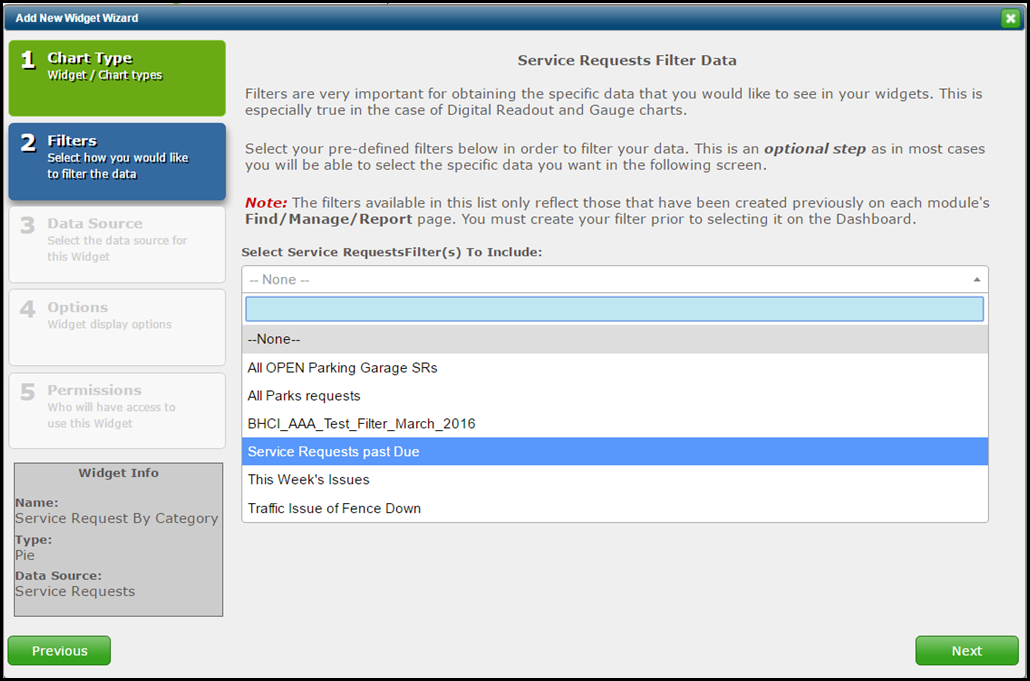
  • Integrate with / Leverage Existing Filters throughout the VUEWorks interface to make it easy for users to get their specific data delivered to their Dashboard without having to re-create anything.

2017-02-01 09_24_51-VUEWorks® 10.2.1962.0 Project_ vueworks Host_ demo.vueworks.com User_ VUEWorks

  • Provide a series of Mathematical Functions (e.g. Count, Average, Min, Max, Sum) that can be organized by Values (Good, Fair, Poor) or Ranges of Values (Bins).

2017-02-01 09_26_41-VUEWorks® 10.2.1962.0 Project_ vueworks Host_ demo.vueworks.com User_ VUEWorks

  • Allow the user to change the Appearance (2D or 3D), Legend Settings (Marker Types, Position) or General Settings (Labels, Font and Margins) related to the Widget.

2017-02-01 09_27_09-VUEWorks® 10.2.1962.0 Project_ vueworks Host_ demo.vueworks.com User_ VUEWorks

  • Integrate with Existing User and Role-based Security found throughout VUEWorks.

2017-02-01 09_27_45-VUEWorks® 10.2.1962.0 Project_ vueworks Host_ demo.vueworks.com User_ VUEWorks

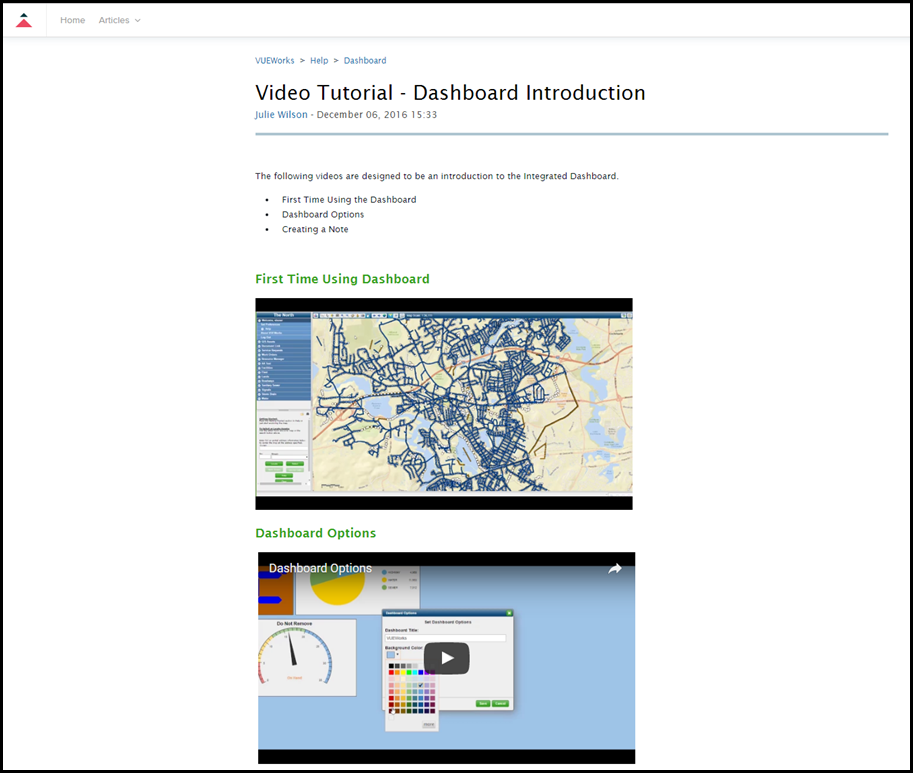
  • Provide easy to use Help and On-line resources to help train users and expose them to new functionality.

2017-02-01 10_07_19-Dashboard – VUEWorks

2017-02-01 10_08_06-Video Tutorial - Dashboard Introduction – VUEWorks

2017-02-01 10_11_01-Video Tutorial - Working with Existing Widgets – VUEWorks

MAP-21 Compliance for State DOTs – Risk-Based Prioritization using VUEWorks

MAP-21 addresses all things related to federal funding and oversight of our nation’s surface transportation and transit systems. The 581 pages of the act are broken down into eight major divisions. These divisions are further delineated into titles and subtitles. Although MAP-21 deals with numerous subjects from national freight policies to how transit funding is calculated for metropolitan planning organizations, our focus today is the portion that addresses how and to what extent State DOTs must proactively manage road and bridge networks through the use of risk-based asset management planning.

The FHWA has developed a proposed rule focused on clarifying and enacting the provisions of Section 1106. Section 1106, which requires a Risk-based Asset Management System, is influenced by Section 1203(a), which establishes national standards for performance management, targets and metrics. These performance measures are intended to provide standards for the inspection of infrastructure assets, pavement rating and maintenance for the National Highway System (NHS) non-Interstate pavements and NHS bridges. Section 1106 is also influenced by Section 1315(b), which requires State DOTs to conduct statewide evaluations to determine reasonable actions or corrections that can be taken on a project basis to alleviate the need for repeated repair or reconstruction of roads, highways or bridges that frequently require attention after an emergency event (i.e. weather event).

As part of the Asset Management Plan, the Notice of Proposed Rulemaking (NPRM) has outlined the following process for State DOTs to use in the development of their Asset Management Plans. This process will need to be documented and discussed in each State DOT’s initial submittal of the plan to the FHWA for program certification.

The State DOT will establish a process for conducting a statewide performance gap analysis of the state’s Interstate and National Highway System (NHS) road assets. The process must also address strategies for closing any identified gaps. A performance gap analysis identifies deficiencies in the areas of asset condition, capacity, design or travel safety that are below the desired system performance level for those assets on the NHS as established by the State DOT.

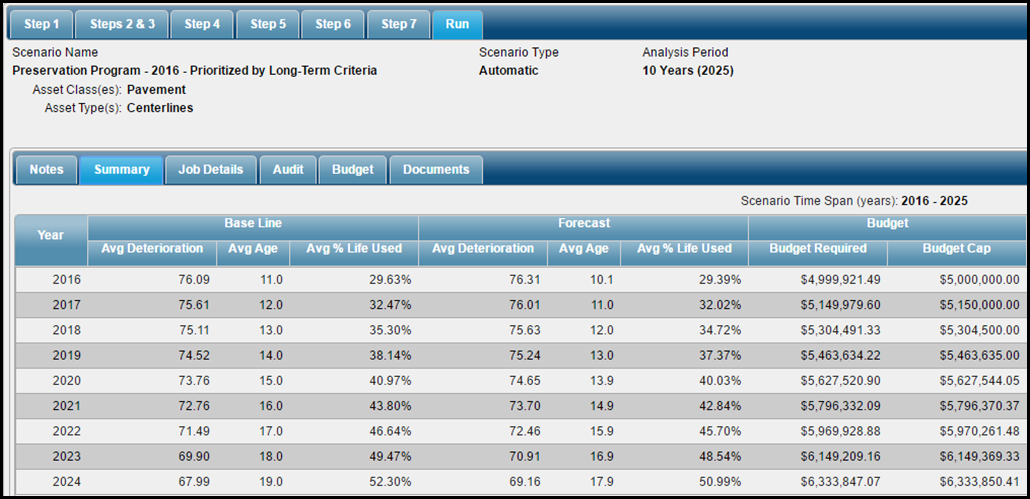
The following graphic illustrates how VUEWorks can provide multiple Budget Forecasting scenarios can be run against an Asset Class (Pavement, Bridges, Stormwater, etc.) to determine the level of funding required to maintain the system in a state of good repair.  The scenario can be run to see what funding is required as well as what existing funding will accomplish for the DOT’s pursuit to achieve a specific level-of-service (state of good repair).

image

The State DOT will establish a process for conducting life-cycle cost analysis (LCCA) for the different asset classes that collectively make up the network in order to develop a Strategic Treatment Plan (STP) for the life of each asset – from the current state of the asset until its ultimate reconstruction, replacement or disposal. A Strategic Treatment Plan looks at all possible treatments over the life of an asset to keep the asset at a performance level that is cost-effective and does not compromise the network’s capacity, safety or long-term life-cycle cost.

As illustrated below, VUEWorks  can be utilized to develop a strategic treatment program for the life-cycle of an asset.  The current deterioration model and condition score for an asset can be compared to its projected life-cycle based on the results of each scenario.  Specific preservation or rehabilitation techniques can be specified to achieve a state of good repair.

image

image

imageThe State DOT will establish a process for assessing risk related to a given NHS asset that could impact that asset’s physical condition, capacity or performance in emergencies or over the long-term. Risks to an asset’s physical condition or its ability to perform can include one or more factors including extreme weather and climate change, seismic activity, traffic volume, traffic loads, sub-par construction materials, time between treatments, etc. As part of the State’s Risk-based Asset Management Plan, the State DOT will be expected to develop an approach to monitor, measure and report on high-priority risks to an asset’s or network’s performance.

Here is an example of a true Risk matrix based on the requirements of MAP-21.  This matrix is reading information from multiple data sources (Linked Data, GIS data and Condition Data) that is tracking each Risk category against each section of road.  The matrix displays each individual category of Risk, ranks it on a scale from 0-10 and then summarizes the Road network as a whole for the DOT.

image

2016-07-14 20_13_28-VUEWorks® 10.2.1922.0 Project_ VUEWorks Host_ demo.vueworks.com User_ Administra

2016-07-14 20_15_11-VUEWorks® 10.2.1922.0 Project_ VUEWorks Host_ demo.vueworks.com User_ Administra 2016-07-14 20_15_26-VUEWorks® 10.2.1922.0 Project_ VUEWorks Host_ demo.vueworks.com User_ Administra

2016-07-14 20_17_01-VUEWorks® 10.2.1922.0 Project_ VUEWorks Host_ demo.vueworks.com User_ Administra

  • Failure Modes
    • Age
    • Distresses
    • Deflection
    • Ride Quality
    • Rutting 
    • Work Orders/History
  • Consequences of Failure
    • Travel Delays
    • Rough Roads
    • Traveler Safety
    • Recovery Cost
    • Air Pollution
    • Traffic Congestion
    • Risk of Accidents
    • Traveler Fatalities
    • Climate Disturbance
    • Freight Delays

The State DOT will establish a process for developing, managing and updating a 10-year financial plan for the construction, maintenance, repair, rehabilitation, reconstruction or disposal of assets in the NHS. The process must allow the State to determine the estimated cost of future work based on the Strategic Treatment Plan (discussed in Item 2 above) and the estimated available budgets.

Budget scenarios can be run against any Asset for any planning horizon to establish a financial plan for each Asset Class and Asset Type.  Different strategies can be employed for each asset to identify the most effective maintenance, preservation or rehabilitation plan for the asset based on the best practices employed by the DOT.

image

The State DOT will establish a process for identifying viable investment strategies for funding long-term operations. This is to ensure that assets along the NHS are maintained at a level that will help the State DOT achieve asset condition and performance targets in alignment with the national goals set forth under United States Code.

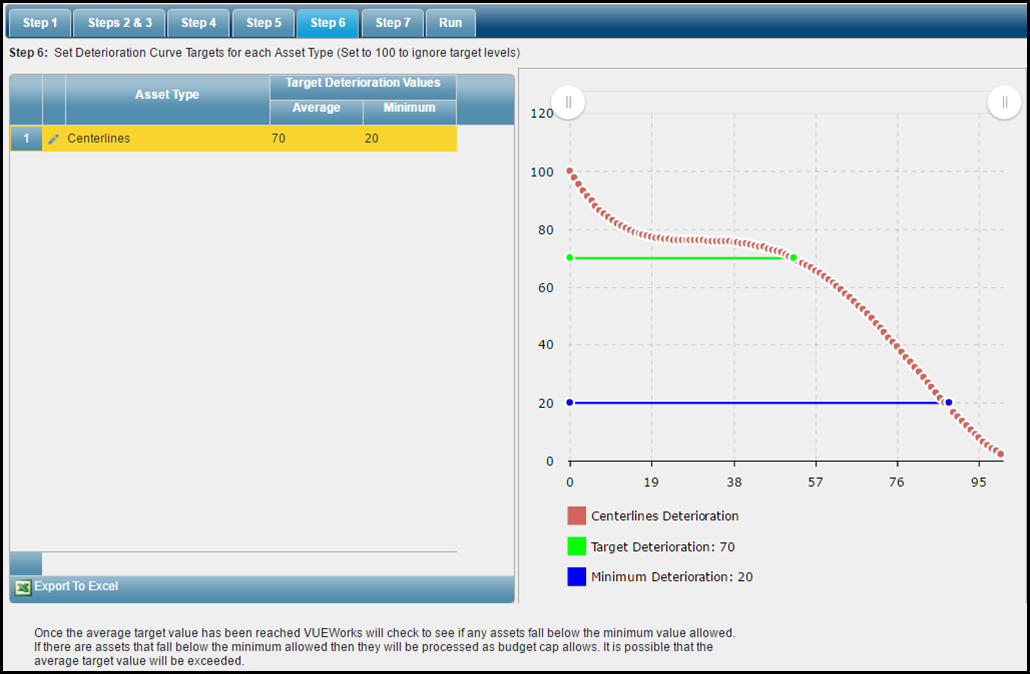
VUEWorks provides the ability to run budget scenarios for each Asset Class and Asset Type to determine the best investment strategies for the Asset’s Life-cycle cost.  Target Deteriorations can be set for the Asset Network (Pavement , Bridge, etc.) and VUEWorks will identify the Target Deterioration that can be achieved or the Funding Strategy required to achieve these goals.

image

The State DOT will use a Pavement Management System (PMS) and a Bridge Management System (BMS) to analyze the condition of Interstate and NHS pavements and bridges to develop, manage and monitor targeted investment strategies.

VUEWorks provides a single, Enterprise Asset Management Solution for State DOTs.  Any asset can be managed within VUEWorks and the guiding principals of MAP-21 can be implemented as part of the DOTs day-to-day Asset Management activities.

image


Asset Management and ADA Compliance–Building a Risk Mitigation Strategy using VUEWorks–Part 2

Asset Management and ADA Compliance–Building a Risk Mitigation Strategy using VUEWorks–Part 2

In our last blog post, we introduced the concept of ADA compliance and discussed an approach to compliance through the utilization of Asset Management principles.  To recap, we talked about the following steps in the process and how each step leads to a more strategic approach to ADA compliance:

image

  • Inventory – Utilizing GIS, mobile mapping and boots-on-the-ground inspection (where required).
  • Assess – Visually inspect infrastructure assets and quantify their compliance.
  • Prioritize – Develop a list of high-risk assets that need immediate attention.
  • Execute – Re-construct, upgrade or maintain infrastructure assets that are part of an annual work plan.
  • Rinse and Repeat – Execute work plan annually and re-assess the network of assets every 3-5 years to update the plan.

image

Step 1 – Inventory

The initial inventory of your network can be accomplished is a variety of ways, but most common methods include Mobile Asset Collection and Boots-on-the-Ground techniques.  Mobile Asset Collection is a fast and cheap way to gather imagery of your street network, from which you can conduct an initial visual assessment of your ADA compliance.  Many agencies use this technology to establish the Location and Characteristics (attributes) of their Sidewalk and Curb Ramp infrastructure.  Knowing this information is half of the battle, since many agencies cannot answer some basic questions related to their infrastructure, including:

  • How many miles of sidewalk do we own and maintain?
  • What kind of condition are our sidewalks (asphalt or concrete) in?
  • How many curb ramps to we own and maintain?
  • Where are we missing curb ramps?
  • Where are our compliance issues located?
  • And many more…

By collecting this initial inventory information, an agency can start to develop its internal plan to gain compliance over time while developing a budget to help achieve this plan.

Step 2 – Assess

The assessment procedure involves a series of steps that are both automated and manual, depending upon the technology used to conduct them.  In most cases, mobile data collection is used to conduct the initial assessment of the assets and then a more rigorous boots-on-the-ground approach is used to fill in the gaps (obscured assets) and to collect data that requires precise measurement such as slope information  (Ramps) and trip hazards (Slab faults and Cracks).  This approach saves both time and money because it is basically a visual assessment that identifies major (Risky) issues and highlights areas that need immediate attention.  Therefore, an agency can lower their risk of litigation by taking measures that focus on short-term, high-risk assets while still providing support for the assessment of longer-term (lower Risk) assets.

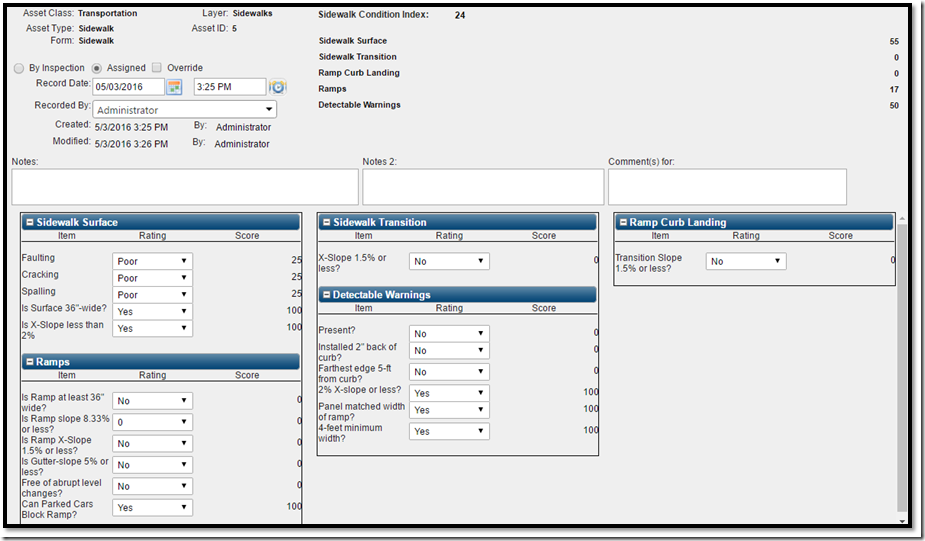
The assessment process can be facilitated within the VUEWorks Asset Management system through the utilization of the Condition (Inspection) module.  As the inspector views the right-of-way imagery, they can record the assessment in a configurable condition form that is designed to record ADA compliance.  The form below illustrates how different Items can be inspected and divided into specific categories.  Each “Category” can be further broken down into specific inspection “Items” that can contain some kind of Condition rating (1-5, Good, Fair, Poor, 0-100, etc).  Each of the individual Items can then be queried individually or combined into an aggregate score by Category and then further rolled-up into an Overall Condition Index for the Asset.

image

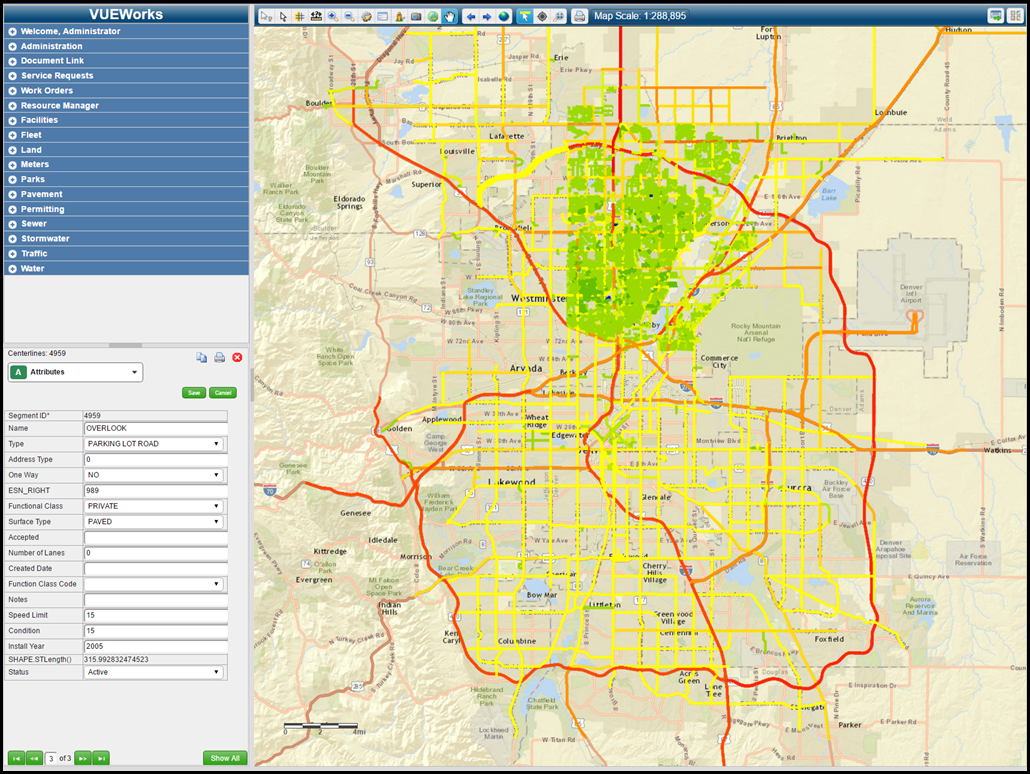
Once the Condition score is generated, the resulting Condition Indices can then be symbolized in the GIS as a visual representation of the Sidewalk/Ramp condition.

image

VUEWorks also provides some useful tools, including integration with Esri Basemaps (ArcGIS Online) and Google StreetView.

image

Step 3 – Prioritize

VUEWorks provides the ability to assess Risk based on the criteria that matter to your organization.  For example, would you go and fix a sidewalk or curb ramp on a road that was travelled by someone with a disability?  Or, would you spend that money elsewhere?  Risk can help you prioritize WHICH asset to fix and WHEN to fix it based on many different criteria.  For example, an agency can look at a few different things when determining WHAT to fix and WHEN to fix it.  They can observe the Consequences of Failure (What happens IF the asset fails) and the Failure Probability (Likelihood of Failure).  As illustrated in the graphic below, the Consequences of Failure can be measured and rated for different categories.  The Failure Probabilities can then be rated based on “How” an asset fails, or its Failure Modes.  Each Failure Mode can contain a different Probability of Failure which allows the agency to understand what the Influencing Failure Mode is when determining what type of maintenance to prescribe for that particular asset.

image

image

Step 4 – Execute

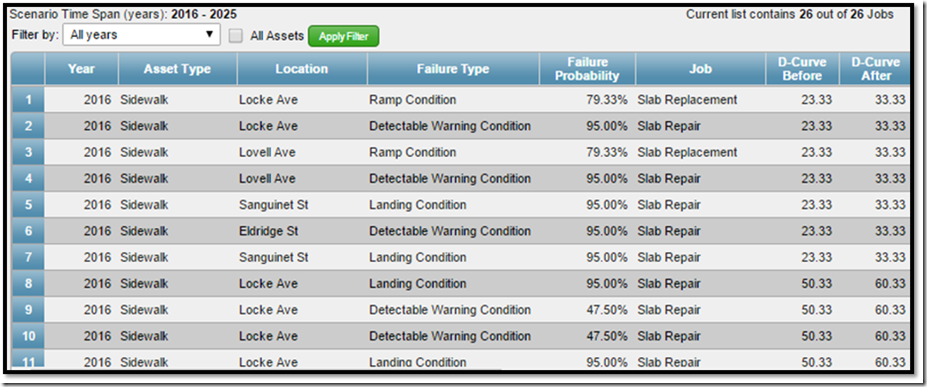
The Budget Forecasting tool in VUEWorks allows user to develop “What-if” scenarios to plan and estimate the cost of projects based on the application of specific Jobs.  Projects can be prioritized based on the Failure Probability, Risk Factor, Criticality Factor or any combination of the above.  Once a project is involved in the plan, its Baseline Condition and the forecasted Condition can be viewed over its life cycle.  All of this information can be used together to develop a Strategic Asset Management Plan utilizing the Intelligence gained for each individual asset the agency maintains.

image

image

At the end of the day, we understand that ADA compliance is a balancing act where limited resources are being applied against assets that are critical to the operation of an agency’s transportation network.  Although other critical infrastructure (Pavement, Signs, Signals, etc.) usually get the bulk of the funding, it is time to focus a portion of these resources against assets that are critical to the safety of our disabled citizens.

Asset Management and ADA Compliance–Building a Risk Mitigation Strategy using VUEWorks

What is the Americans with Disabilities Act?

The Americans with Disabilities Act of 1990 (ADA) prohibits discrimination and ensures equal opportunity for persons with disabilities in employment, State and local government services, public accommodations, commercial facilities, and transportation. Final regulations revising the Department’s ADA regulations, including its ADA Standards for Accessible Design was published in the Federal Register on September 15, 2010 (corrections to this text were published in the Federal Register on March 11, 2011). ADA covers all state and local governments, including those that receive no federal financial assistance.

While the ADA has five separate titles, Title II is the section specifically applicable to “public entities” (state and local governments) and the programs, services, and activities they deliver.  The Department of Justice (“DOJ” or the “Department”), through its Civil Rights Division, is the key agency responsible for enforcing Title II and for coordinating other federal agencies’ enforcement activities under Title II.  DOJ is the only federal entity with the authority to initiate ADA litigation against state and local governments for employment violations under Title I of the ADA and for all violations under Title II of the ADA.

Who does it Affect?

  • Americans with disabilities and their friends, families, and caregivers
  • Private employers with 15 or more employees
  • Businesses operating for the benefit of the public
  • All state and local government agencies

Title II of the Americans with Disabilities Act (ADA) requires that state and local governments ensure that persons with disabilities have access to the pedestrian routes in the public right of way. An important part of this requirement is the obligation whenever streets, roadways, or highways are altered to provide curb ramps where street level pedestrian walkways cross curbs. This requirement is intended to ensure the accessibility and usability of the pedestrian walkway for persons with disabilities.

What is the Difference between Maintenance or Alteration?

An alteration is a change that affects or could affect the usability of all or part of a building or facility. Alterations of streets, roads, or highways include activities such as reconstruction, rehabilitation, resurfacing, widening, and projects of similar scale and effect. Maintenance activities on streets, roads, or highways, such as filling potholes, are not alterations. Treatments that serve solely to seal and protect the road surface, improve friction, and control splash and spray are considered to be maintenance because they do not significantly affect the public’s access to or usability of the road.  Some examples of the types of treatments that would normally be considered maintenance are:  painting or striping lanes, crack filling and sealing, surface sealing, chip seals, slurry seals, fog seals, scrub sealing, joint crack seals, joint repairs, dowel bar retrofit, spot high-friction treatments, diamond grinding, and pavement patching.  In some cases, the combination of several maintenance treatments occurring at or near the same time may qualify as an alteration and would trigger the obligation to provide curb ramps. 

Where must Curb Ramps be Provided?

Generally, curb ramps are needed wherever a sidewalk or other pedestrian walkway crosses a curb. Curb ramps must be located to ensure a person with a mobility disability can travel from a sidewalk on one side of the street, over or through any curbs or traffic islands, to the sidewalk on the other side of the street. However, the ADA does not require installation of ramps or curb ramps in the absence of a pedestrian walkway with a prepared surface for pedestrian use. Nor are curb ramps required in the absence of a curb, elevation, or other barrier between the street and the walkway.

What are Detectable Warnings?

“A standardized surface feature built in or applied to walking surfaces or other elements to warn visually impaired people of hazards on a circulation path.

  • ADAAG: Required on curb ramps, hazardous vehicular areas, and reflecting pools, but not on doors to hazardous areas. The warnings must be truncated domes (§4.29). 
  • UFAS: “Tactile warnings” (uses different terminology) required only on doors to hazardous areas. Must be a textured surface on the door handle or hardware (§4.29).

As a Public Agency, How Should I approach Compliance with Limited Resources?

Public agencies are constantly chartered with conducting business and doing “more with less”.  This includes achieving compliance with Federal Mandates that require infrastructure investment, but do not provide a funding mechanism to support it.  In the industry, we call them “unfunded mandates”. 

Many agencies struggle with these mandates for the following reasons:

  1. The existing infrastructure is non-compliant and therefore requires significant investment to bring it into compliance.
  2. Agencies do not have the ability to pay for the infrastructure enhancements required to achieve compliance.
  3. Agencies are hesitant to assess their compliance because if they document problems, then they feel obligated to fix them.

Therefore an attitude of “If I don’t know how bad the problem is, I can ignore it for the time-being…” becomes pervasive throughout many of these Public Entities.  By “not knowing” how non-compliant their agency is in regards to this requirement, the agency is actually creating more litigation risk for itself.  At VUEWorks, we have developed an ADA-compliance methodology that utilizes GIS and Risk-based prioritization to develop a long-term plan focused on ADA compliance.

The plan is simple and follows the typical Asset Management life-cycle approach:

  • Inventory – Utilizing GIS, mobile mapping and boots-on-the-ground inspection (where required).
  • Assess – Visually inspect infrastructure assets and quantify their compliance.
  • Prioritize – Develop a list of high-risk assets that need immediate attention.
  • Execute – Re-construct, upgrade or maintain infrastructure assets that are part of an annual work plan.
  • Rinse and Repeat – Execute work plan annually and re-assess the network of assets every 3-5 years to update the plan.

Next week’s blog will focus on how VUEWorks is utilized to achieve ADA compliance while limiting litigation risk to your agency…

Visualizing Pavement Distress–The Complete Story of Pavement Inspection

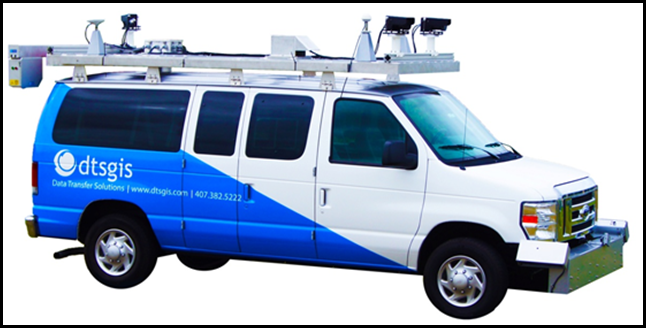
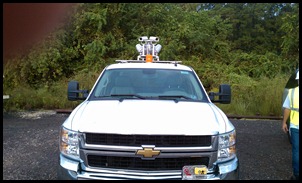
Pavement management incorporates data collected utilizing various methods to gain a complete view of how the pavement is performing through its life-cycle.  One of the most common practices in pavement inspection is imaging utilizing high-resolution cameras mounted on vehicles outfitted with precision GPS and inertial navigation.  This imaging, when combined with laser profiling, constitutes a typical pavement inspection setup utilized by many DOTs as well as Local government agencies.

image

Pavement Inspections tend to follow a process that in many cases is proprietary and “black box” in nature.  This makes it hard for the purchasing agency to see how their roads were inspected and how the resulting pavement condition scores were generated.  Our team of Engineers and GIS professionals have worked hard to develop a process to remove the “black box” related pavement inspection and to make it easy and simple to trace inspection results back to their originating distresses from the field.

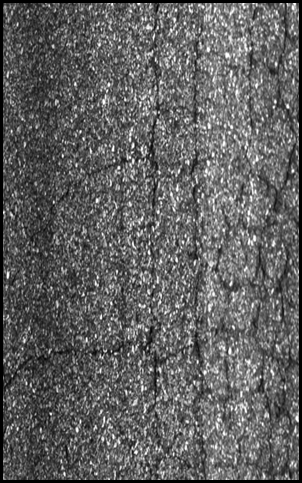
First, our entire process is geospatial in nature from the get-go.  Our van’s location is tracked in six-dimensions in real-time and this information is used to calculate the exact location of pavement cracks in the resulting images.  Next, the pavement images are geospatially referenced in 3-d and 1mm-pixel resolution, making it easy to extract low-severity cracks in a true 3-d environment.  This process then allows us to create GIS vectors (points, lines and polygons) of each distress for each pavement image and deliver them to our clients as part of the pavement inspection deliverables.

imageimage

This is a crucial piece to the pavement inspection “story” because it shows the purchasing agency exactly what distresses were identified and measured when creating the pavement condition scores for a section of road.  Being able to see these distresses on a map helps to complete the story by providing the ability for a rigorous QA/QC process utilizing some simple GIS tools.

Each Section of road can be colored by the condition score and its range of values.  This tells one component of its story.  The underlying distress information tells the rest of the story related to “How” a section of road was scored and assigned its inspection score.  By having this information at their fingertips, pavement inspection personnel have a GIS-centric and user-friendly tool that allows them to QA/QC pavement inspection data efficiently.

image


Asset management strategies–which is right for me?

We get a lot of questions about developing the right strategy as it relates to assets that are managed by different agencies.  These questions are typically focused on “How” to manage assets, which typically comes after the agency decides “Why” to manage assets.

Here are some typical questions:

  1. When is the best time to manage my asset in its life-cycle?
  2. When do I rehabilitate my asset?
  3. What do I do to the asset?
  4. When do I replace my asset?
  5. Can I just let it runs its course and when it fails, replace it?
  6. Should I invest time and money in an asset early in its life-cycle or wait until it is in poor condition to fix it?

We always recommend starting this process by understanding a few things about the asset.

1.  Financial Considerations – How much does an asset cost to install and Maintain?  Is it capitalized or not?   In most cases, the cost of an asset has a large impact on how it is managed.  This is not the only consideration, but we can use it as a starting point.

image

2.  Risk Considerations – What are the consequences to the agency if this asset fails?  Will someone get hurt?  Will it cause an accident?  These are closely tied to other financial considerations such as tort liability.

image

3.  Life-Cycle Considerations – How does the asset typically deteriorate?  Is it straight-line deterioration or more of a polynomial-type of a curve?  This information helps determine what to do to an asset and when to do it (less cost when starting earlier in the process).  Programmatic treatments or inspection-driven treatments are common approaches to managing assets with this approach.

DCurves

Once an agency has a solid understanding of the Financial, Risk and Life-Cycle considerations related to an asset, they can begin to develop a management strategy specifically for the asset type to be managed.  Since every asset can be managed differently, we will focus on a couple of assets and their management strategy.

Pavement

  1. Financial – Capitalized asset – high cost to install and maintain.
  2. Risk – Critical to the movement of people and commerce – high consequence of failure.
  3. Life-Cycle – Long-term asset with long-term life expectancy – Can be managed using a life-cycle or Inspection-based approach.

Pavements have a long history of research and empirical data models that have been developed for Airports, Parking lots and Roads and a variety of software exists to support the maintenance of this asset.  Therefore, it is pretty easy to choose an approach to manage pavement based on an agency’s goals and priorities.  Typically this program is inspection-driven (every 3-5 years) and focuses on finding the best mix of Preservation and Rehabilitation activities designed to achieve their target Level-of-Service.

Signs

  1. Financial – Capitalized asset – low to high cost to install and maintain.
  2. Risk – Critical to the safety of people and commerce – low to high consequences of failure.
  3. Life-Cycle – Medium to long-term life-expectancy – Can be managed using a life-cycle or Inspection-based approach.

Signs have less empirical data collected for them and can have varied Financial, Risk and Life-cycle information compiled and available throughout the industry.  Strategies for management are typically focused on Life-Cycle and Risk and there are many methodologies that are accepted by FHWA.  These are outlined in their Manual on Uniform Traffic Control Devices (MUTCD) and are widely utilized throughout the US.

Light Poles

  1. Financial – Capitalized asset – medium cost to install and maintain.
  2. Risk – Semi-Critical to the safety of people and commerce – low to high consequences of failure.
  3. Life-Cycle – Medium to long-term life-expectancy – Can be managed using a life-cycle or Inspection-based approach.

Light poles are typically managed by inspection of their base attachments (every 10 years or so) but many agencies typically run these assets to failure (luminaire failure or pole failure).  This is another mixed bag of management because some light poles provide a critical safety function (DOT) and others just light the way for safety (walkways) and are not as critical to the daily operations of an agency.

These are just a few examples of strategy development – we would love to see comments related to the infrastructure that you manage and we will reply with some of the Industry’s Best-Management-Practices (BMPs) that are successfully used throughout the US.

Mobile LiDAR to Support Positive Train Control

This article was originally written in 2011, but is being re-posted based on recent events…

DTS/Earth Eye just completed a positive train control (PTC) project for a national train company who was evaluating the differences between Airborne LiDAR and Mobile LiDAR to support the collection of PTC data.  They are currently collecting airborne data for approximately 15,000 linear miles of rail.  In certain areas, the airborne data does not provide enough fidelity to accurately map the rails or the asset infrastructure that support the railroad operations.

From Wikipedia – “The main concept in PTC (as defined for North American Class I freight railroads) is that the train receives information about its location and where it is allowed to safely travel, also known as movement authorities. Equipment on board the train then enforces this, preventing unsafe movement. PTC systems will work in either dark territory or signaled territory and often use GPS navigation to track train movements. The Federal Railroad Administration has listed among its goals, “To deploy the Nationwide Differential Global Positioning System (NDGPS) as a nationwide, uniform, and continuous positioning system, suitable for train control.”

The project involved the collection of Mobile LiDAR using the Riegl VMX-250 as well as forward-facing video to support PTC Asset Extraction.  The system was mounted on a Hi-Rail vehicle and track access was coordinated through the master scheduler with the Railroad company.  Once we had access to the tracks, we had one shot to make sure the data was collected accurately and we had complete coverage.  All data was processed on-site to verify coverage and we had a preliminary solution by the end of the day that was checked against control to verify absolute accuracies.  We collected the 10-mile section of rail in about 2 hours and this timing included a couple of track dismounts required to let some freight trains move on through.

IMAG0166IMAG0168

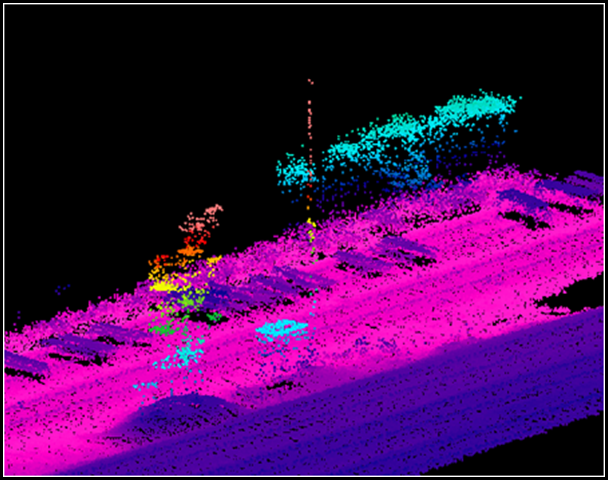
The following graphics illustrate the point cloud coverage colored by elevation (left) and Intensity (right).

imageimage

imageimage

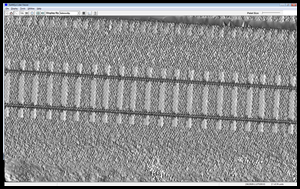
Mapping the rails in 3D was accomplished by developing a software routine designed to track the top of the rail and minimize any “jumping” that can occur in the noise of the LiDAR data.  Basically, a linear smoothing algorithm is applied to the rail breakline and once it is digitized the algorithm fits it to the top of the rail.  The following graphic illustrates how this is accomplished – the white cross-hairs on the top of the rail correspond to the breakline location in 3D.

image

So, back to the discussion about Airborne PTC vs Mobile PTC data.  Here is a signal tower collected by Airborne LiDAR.  The level of detail needed to map and code the Asset feature is lacking, making it difficult to collect PTC information efficiently without supplemental information.

image

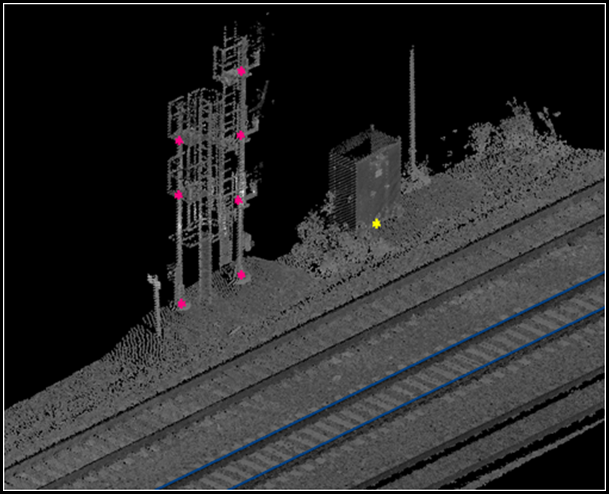
The next graphic shows the detail of the same Asset feature from the mobile LiDAR data.  It is much easier to identify the Asset feature and Type from the point cloud.  In addition to placing locations for the Asset feature, we also provided some attribute information that was augmented by the Right-of-Way camera imagery.  By utilizing this data fusion technique, we can provide the rail company with an accurate and comprehensive PTC database.

image

This graphic shows how the assets are placed in 3D, preserving the geospatial nature of the data in 3D which is helpful when determining the hierarchy of Assets that share the same structure.

image

One last cool shot of a station with all of the furniture, structures, etc that make it up – pretty cool!

image

Strategic Asset Management vs. Work Management–What’s the Difference?

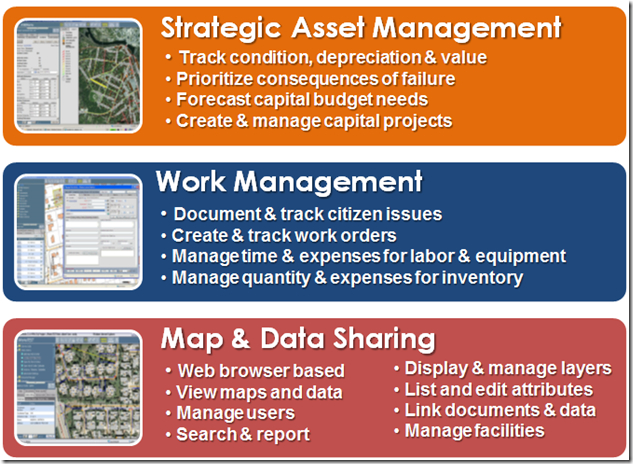
We do business with a lot clients these days who are looking for an “Enterprise Asset Management” system .  They use this term during the procurement process, but in a lot of cases their requirements are centered on Work Management and barely scratch the surface of Asset Management.  This is easy to do since most of an organization’s daily activities are focused solely on today’s maintenance of their Asset Infrastructure, but there is very little focus on how they will manage and maintain assets into the future.  Our clients are always answering questions related to the fiscal activities centered on asset performance.  The questions from management are centered around:

  • How much are we spending on maintenance?
  • How long does it take us to respond to and fix an issue?
  • Are we meeting Federally mandated requirements?
  • Anything else relating to money…

The IAM defines asset management as the “coordinated activity of an organization to realize value from assets”.  This involves the “balancing of costs, opportunities and risks against the desired performance of assets, to achieve the organizational objectives.”  An additional objective is to “minimize the whole-life cost of assets but there may be other critical factors such as risk or business continuity to be considered objectively in this decision making.”  All of these factors can be combined together to make informed decisions regarding how assets are managed and maintained throughout their life-cycle.  These decisions involve monetary expenditures, but they also involve strategic thinking centered on the “How” and “Why” to fix an asset as well as “When” and “Which” portions of this process.  This is the “Strategic” piece of an Asset Management system.

image

Work Management is one small component of Asset Management.  It is typically focused on the day-to-day operations and expenditures related to operating and maintaining asset infrastructure.  The Work done against an asset can track cost information, but can also be used to build a strategy around the operations and maintenance related to that asset.  This strategy focuses on the “How” and “Why”.  It answers what “Activity” should be completed for an asset (Install, Maintain, Repair, Replace) and “Why” (It’s old, looks bad, is dangerous, could cause injury, get us sued) this should happen.  Next, it answers “When” (now, next year, or never) an asset should be maintained as well as “Which” (most critical, most likely to fail, the Mayor’s sewer line) assets should get priority.  All of these factors are important and ALL of them should be utilized when making a Strategic Asset Management decision.  Be reminded that Work Management is only one component of this decision-making criteria which is applied to an overall Strategic Asset Management plan.

Roadway Characteristics Inventory for DOTs Using Mobile LiDAR Technology

Roadway Characteristics Inventory for DOTs Using Mobile LiDAR Technology

DOTs across the Country are mandated by the Federal Government to keep track of their roadway assets and to report against these assets to receive Federal funding for their maintenance and repair. Many DOTs conduct Roadway Characteristics Inventories (RCI) on an annual basis to update and maintain their data relative to these assets. Traditionally, this has been completed using a boots-on-the-ground approach which has been very effective at building these inventories. Many DOTs are experimenting with other technologies, namely mobile LiDAR, to conduct these inventories and to achieve many other benefits from the 3D data captured in the process.

The next graphic illustrates the typical technology solution utilized for these projects. It is composed of the Riegl VMX-450 LiDAR unit, coupled with High-definition Right-of-Way (ROW) imagery. This system can collect at rates up to 1.1 KHz (1,100,000 pts/sec) at a precision of 5mm. It collects points in a circular (360-degree) pattern along the right-of-way from 2 scanner heads facing forward and to the rear of the vehicle in a crossing pattern. The laser captures 3D points at a density of 0.3 foot at speeds up to 70mph. This scanner can be adjusted to scan at a rate that is applicable for the project specifications to limit the amount of data collected and to ensure that the resulting point cloud data is manageable.

Mobile_LiDAR_DOTs_RCI

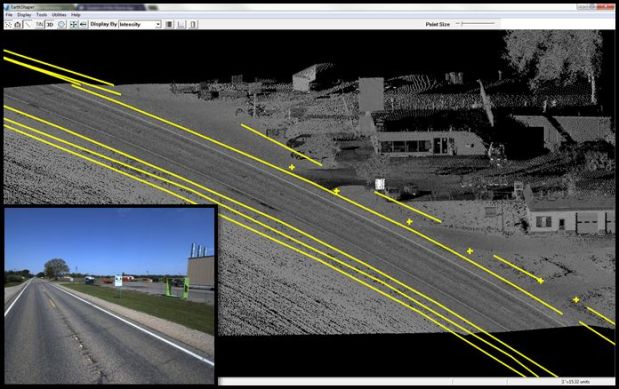
Right-of-Way imagery is also co-collected along with this LiDAR point cloud data. These images are used to identify appropriate attribution for each feature type being extracted from the point cloud. In this example, the DOT has digitized Shoulder, Driveway Culvert Ends, and Drainage Features (Culverts, Ditches and Bottom of Swale). Additional Features such as Signs, Signals, Striping, and Markings will also be extracted and then reported to the Feds on an annual basis. The mobile LiDAR data provides a 3D surface from which to compile the data and then the ROW imagery can be used for contextual purposes to support attribution. This methodology provides an effective process that can be used to create 3D vector layers and accurate attribution used to build a robust Enterprise GIS.

Both the ROW imagery and the mobile LiDAR can be used to collect and extract the RCI data efficiently for the DOTs and provides the DOT with a robust data set that can be leveraged into the future. The ROW imagery is typically used to map features at a mapping-grade level while the LiDAR can vary a bit in accuracy. Since the relative accuracy inherent in the LiDAR is very precise, it is used to conduct dimensional measurements related to clearances, sign panel sizes, lane widths, and other measurements that require a higher precision.

The DOT utilizes the derivative products from this RCI exercise to report to the Feds in a way that is pretty basic, but effective to achieve their level of funding. For example, the data capture is very technical in nature and focuses on high precision and accuracy. Then, the RCI data is extracted from this source data, maintaining a level of precision that is dictated by the source data. Then, the DOT takes this precise data and aggregates it up to a higher level and reports the total number of Signs or the lineal feet of guardrail. Even though the reporting of this data is pretty basic in nature, the origins of the data can still have precision and accuracy and can be used for other purposes related to Engineering Design or Asset Management.

In conclusion, mobile LiDAR and Right-of-Way imagery are a safe and accurate way to collect and report against RCI variables for DOTs. This methodology promotes a safe working environment for both the DOT worker and the traveling public. It is also a cost-effective way to collect large amounts of 3D point cloud data which can be utilized for other purposes within the same Agency.

Efficient Measurement of Bridge and Overhead Structure Clearance Information at Posted Highway Speeds

For most DOTs, knowledge of vertical clearances between the paved roadway surface and vertical structures is an important piece of information that supports the routing of oversized permit vehicles. In addition, horizontal clearances under overhead structures between fixed objects such as bridge columns, railings and median barriers are also important to ensure oversized objects do not impact the structure. Most DOTs use this information for posting clearance signs identifying the vertical clearance of structures and utilize the horizontal clearance information to route oversized vehicles. There are also Federal reporting requirements as part of the National Bridge Inventory (NBI) program that is administrated by FHWA. Many DOTs measure vertical clearances as a single, minimum value under each bridge or overhead structure. This is typically measured by field personnel who are exposed to moving traffic, lane closures and traffic delays, which create safety issues along the road. This manual measurement methodology can also be inaccurate because of the “human factor” involved in making these measurements. The position of the minimum value gets applied to the entire structure, even though it may be in a position that can easily be avoided with proper planning. This methodology can also create situations where a manual measurement methodology may not identify the true minimum clearance because it was missed because of the measurement technology limitations. There are a handful of DOTs in the industry who are using mobile LiDAR technology to inventory their overhead obstructions using mobile LiDAR and right-of-way imagery. This blend of technology is a cost-effective way to precisely measure these clearances while effectively increasing safety for workers and the traveling public. The information gathered here can be used to:

  1. Update the NBI database,
  2. Routing of oversize permit vehicles
  3. Bridge Vertical Clearance Signage
  4. Maintain an Inventory of Overhead Sign and Bridge inventory.

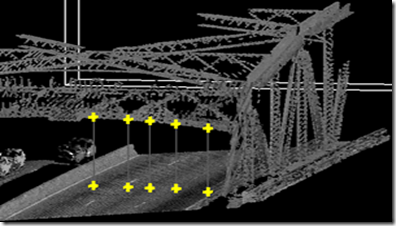
The next set of graphics illustrates the typical technology solution utilized for these projects. It is composed of the Riegl VMX-450 LiDAR unit. This system can collect at rates up to 1.1 KHz (1,100,000 pts/sec) at a precision of 5mm. It collects points in a circular (360-degree) pattern along the right-of-way from 2 scanner heads facing forward and to the rear of the vehicle in a crossing pattern. The laser captures 3D points at a point density along the ground of approximately 0.001 feet at speeds up to 70mph. This scanner can be adjusted to scan at a rate that is applicable for the project specifications to limit the amount of data collected and to ensure that the resulting point cloud data is manageable. Right-of-Way imagery is also co-collected along with this LiDAR point cloud data. These images are used to identify appropriate attribution for each feature type being collected. They are also used to identify the real-world features that are measured and the exact location of the minimum vertical clearance for the Bridge or Overhead structure. The following graphic illustrates these concepts.

clip_image002 clip_image004
Dual Head Scanners – One-Pass Technology Dense Point Clouds for Precise Measurements
clip_image006
High-Resolution Right-of-Way Imagery is Used to Identify Clearance Structure for Measurement
clip_image008
LiDAR Point Cloud of Same Overhead Structure with Clearance Measurements
clip_image010
Right-of-Way Imagery Fused with LiDAR Point Cloud for Photo-Realistic View
clip_image012 clip_image014
Bridge Clearance Measurements (LiDAR Intensity View) Bridge Clearance Measurements (LiDAR Fusion View)
clip_image016
Local Orthophotography and LiDAR data co-registered to support the data extraction process
clip_image018 clip_image020
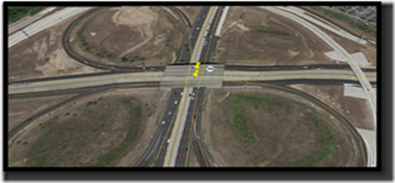
Google Earth is used as a reference during compilation to verify bridge location and layout.

Once the data has been captured in the field, it is post-processed back in the office using a semi-automated approach. The Overhead Structure or bridge is classified in the point cloud using a manual process. The overhead points are classified into an “Overhead/Bridge” class. Then, the software automates the analysis of finding the lowest clearance point for a column of the data set.

clip_image022
Bridge Structures Illustrated in Point Cloudsclip_image024

For example, the user can set a preference to search a radius of 1-foot and then the software will automatically find the closest ground point corresponding to the column of data. The minimum clearance value will be identified and recorded in the software for that column of data. This process is automatically repeated for the remainder of the structure until the minimum clearance point has been identified and located in the point cloud. The user can specify the output of the data as either a single minimum clearance of that structure, or can identify the lowest point vertically along a horizontal distribution of measurements. An example of this would be to return the lowest point per lane across a roadway for a particular structure. In conclusion, mobile LiDAR and Right-of-Way imagery are a safe and accurate way to measure the horizontal and vertical clearance of overhead and bridge structures. This methodology promotes a safe working environment for both the DOT worked and the traveling public. It is also a cost-effective way to collect large amounts of 3D point cloud data and process it efficiently as it is applied on a per-structure basis.